Metals
Stunning Development In The U.S. Silver Market
by Steve St. Angelo, SRS Rocco Report:
Something quite interesting took place in the U.S. Silver Market over the past several months. Not only are we witnessing a shortage of silver investment products in the retail and wholesale markets, but there is also another interesting development that many are unaware. Actually, I was quite surprised by the recently released data.
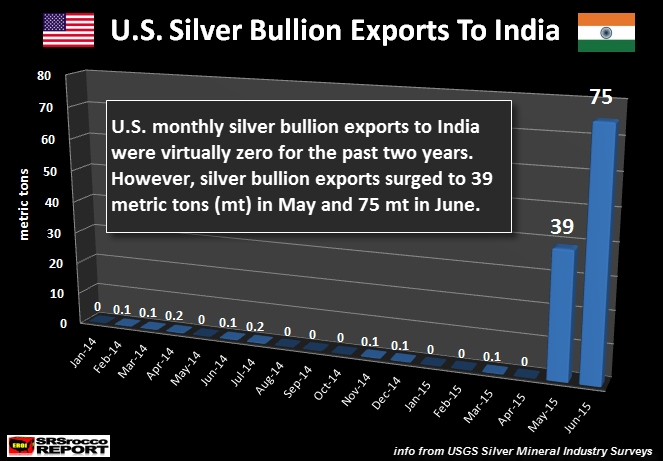
According to the USGS, (U.S. Geological Survey), U.S. silver bullion exports to India exploded in June. Now, when I say, “Exploded”, this is not an overstatement at all. If we look at the chart below, we can see how U.S. silver bullion exports to India went from virtually nothing to 75 metric tons (mt) in June:
Normally, I have been focusing on U.S. Silver bullion imports as they increased significantly this year. However, I overlooked this interesting data tidbit as the overwhelming majority of U.S. silver bullion exports are shipped to Canada. Matter-a-fact, of the 214 mt of total U.S. silver bullion exports January-April, Canada received 90% (191 mt).
I have to say, it was quite a surprise for me to see U.S. silver bullion exports to India surge to 39 mt in May and then 75 mt in June. As you can see in the chart above, the most silver bullion India imported was 0.2 mt in a month. This is less than peanuts. Basically, a rounding error.
So, what gives? Why are the Indians now importing silver bullion from the United States? Well, if you have been reading my articles or other folks on the internet, Indian silver imports surged 61% in the first five months of the year. Thus, India importing silver from the United States would be a logical conclusion. However, India imported a record 7,000 mt of silver in 2014, with virtually ZIP from the United States.
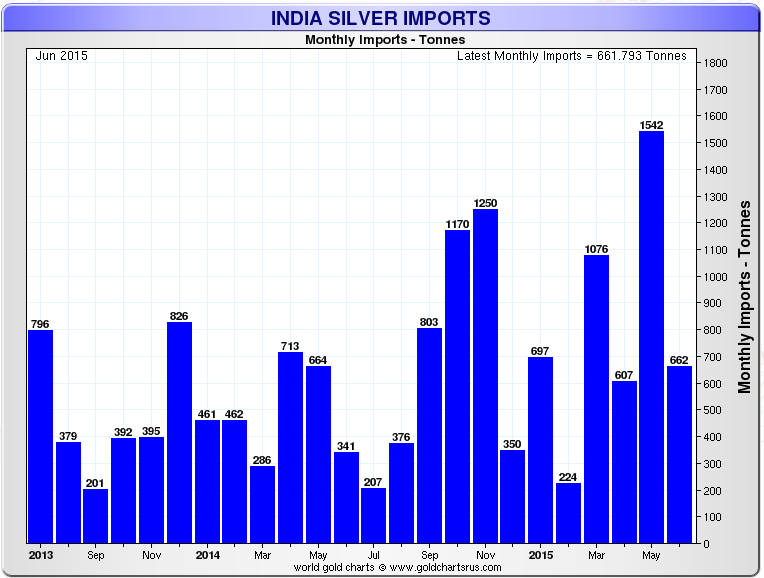
According to the chart put out by Sharelynx.com, India imported a lot of silver in the first four months of 2015, but didn’t receive any (okay, 0.1 metric ton… LOL) from the United States:
India imported 35% more silver from January to April, compared to the same period last year, without tapping into the U.S. Silver Market. But, as we can see in the chart above, India silver imports skyrocketed in May to 1,542 mt. However, even with this huge increase, India only imported 39 mt from the United States. It was during the next month in June, when India’s silver imports declined to 662 mt, did the U.S. export that record 75 mt.
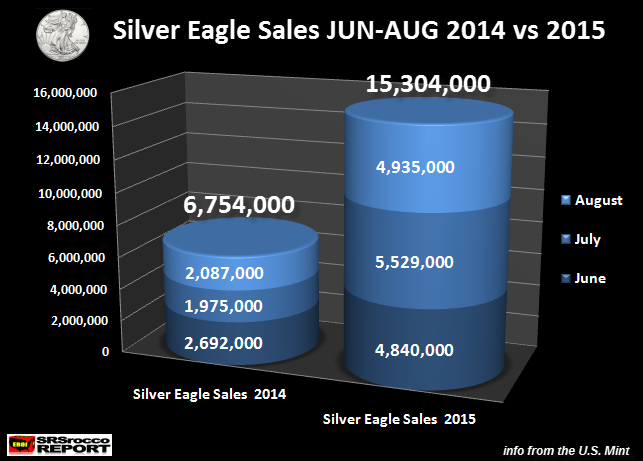
We must remember this spike in U.S. silver bullion exports to India took place during the same time the Greek government threaten to exit the European Union. This was also at the same time when U.S. Silver Eagle coin sales surged to 4.8 million in June compared to 2.7 million during the same month last year:
For whatever reason, U.S. silver bullion exports to India exploded in June. It will be interesting so see the USGS silver bullion export data for July, August and September when its released over the next several months.
COMEX Registered Silver Inventories Monthly Rate Of Decline… Surged In 2015
While the current shortage in the retail silver market continues to stress investors as they have to wait 6 to 8 weeks for certain products, it seems to be carrying over into the 1,000 oz wholesale silver market. One of the leading indicators of the wholesale silver market is the COMEX Registered Silver Inventories.
NOTE: The Difference between Eligible and Registered Silver Inventories
The Eligible category means that the silver is in a condition that conforms to the standards of delivery. Size and quality of the bar in other words. It is being stored at the Comex warehouse, but is not offered for delivery into contracts.
Registered means that the silver is available for delivery to those who demand bullion by being registered as such with a bullion dealer, in addition to being in a fit condition to satisfy the contract.
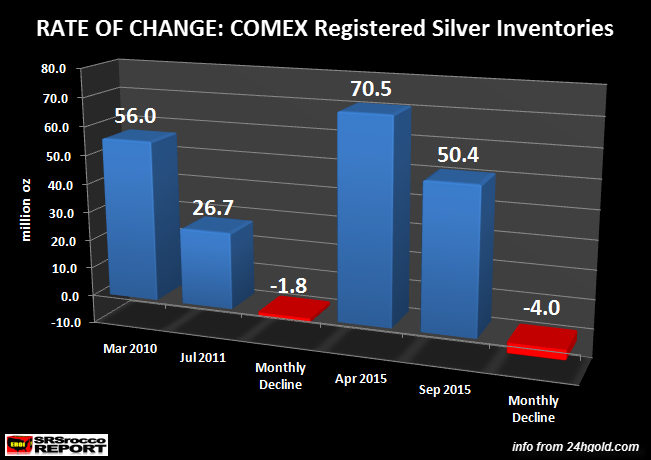
I looked over the COMEX silver inventory data and came across a surprising trend. If we look at the chart below, we can see the change in COMEX Registered Silver Inventories over two periods. These two periods occurred when the COMEX was experiencing a decline in Registered Silver Stocks:
When the price of silver was rising along with investment and industrial demand, the COMEX Registered silver inventories declined from 56 mt in March 2010 to 26.7 mt in July 2011. During this period, the average decline of Registered silver was 1.8 million oz (Moz) per month.
In contrast, the current average monthly decline rate in the Registered silver inventories is much higher. Amazingly, the Registered silver inventories fell to the present 50.4 Moz level after peaking in April at 70.5 Moz. This was a stunning 20 Moz decline, averaging 4 Moz per month… more than double the previous downturn.
Read More @ SRSroccoreport.com

