 Zero Hedge
Metals
Traders Are Buying Gold & Silver At Fastest Pace In Over A Decade
from Zero Hedge.com:
The last time large speculators were as aggressively buying silver as last week was September 1997. The net long non-commercial positioning in Silver futures, according to the CFTC rose almost 22,000 contracts last week to a 3-month high (which is closing in on the ‘longest’ since 2005). Gold, not be out-precious’d also saw major buying. Net speculative longs in gold added over 45,000 contracts – the most since July 2005 – lifting net long positions to their highest in 3 months. Perhaps, just perhaps, asAlhambra’s Jeffrey Snider notes, this is due to Yellen putting the ‘dollar’ back on suicide watch.
Large speculators increased Silver net long position to $4.4bn from $2.4bn notional.
Large speculators increased their net long gold exposure to $14.8bn from $9.2bn notional.
Charts: Bloomberg
Contrarian or not, perhaps Alhambra’s Jeffrey Snider’s view that Janet Yellen’s contortions have put the dollar back on suicide watch are creeping into the market…
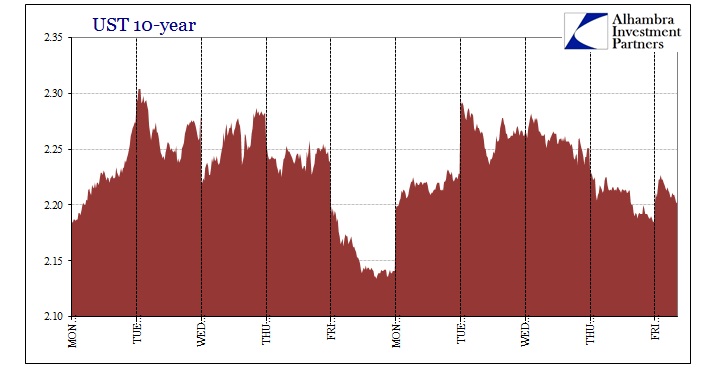
Volatility in UST trading declined a bit in the past few days, as treasury yields became far more settled intraday. While that breaks the exact duplication Monday and Tuesday this week traced from Monday and Tuesday last week, the past two weeks overall remain remarkably similar. And for all the noise, the ups and downs along the way, treasury yields haven’t much changed. That observation applies as far back as May 6, which means that for all the mess there isn’t any more clarity.
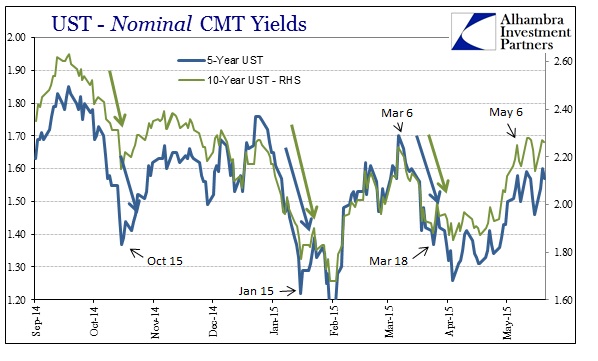
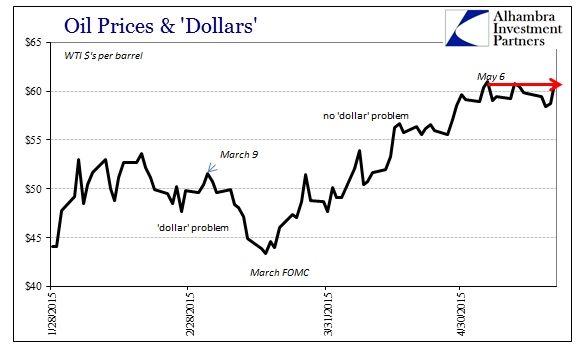
Far be it for UST’s to be trading sideways alone, it seems as if oil prices (front end) have fallen into the same. Adding oil to the discussion immediately frames this as relating to the state of the “dollar” in more recent weeks, which looks to be in sharp contrast to the period between March 18 (FOMC) and May 6. Nominal rates were rising rather steadily in those nearly two months right alongside oil prices.
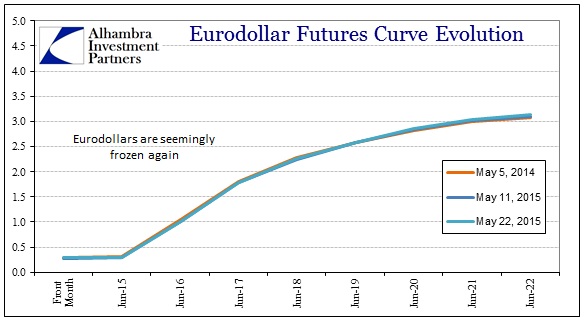
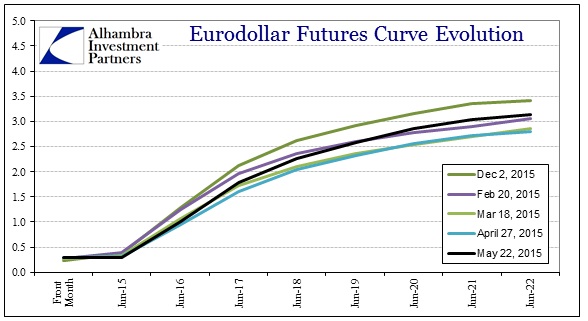
The eurodollar curve has also gone limp, as eurodollar futures trading has found an extremely narrow range also since May 6. This, too, marks a defined shift from the March 18 to May 6 period, meaning that UST credit, oil prices and eurodollar futures all likely share the same inflection.
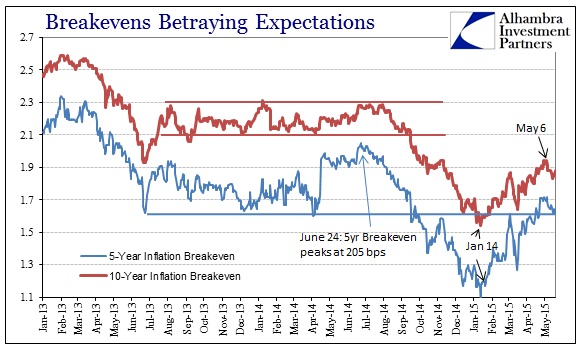
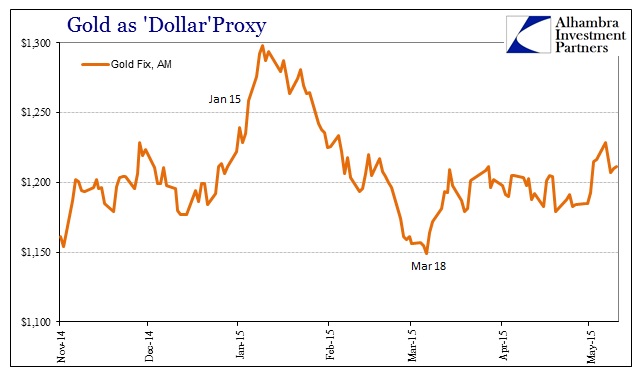
We can also add “inflation” breakevens, at least as far as a potential change dating to May 6. Breakevens had been rising rather steadily since January 15, which I still think was an indication of hedging for (against?) the next QE.
These rates and prices are a broad enough survey, especially as unified by May 6, to at least entertain the suggestion about whether the “dollar” pause that began on March 18 has ended. That may be taking it too far at this moment, since there aren’t any actual and sustained moves in a countertrend, so it may be more reasonable to instead assume a at the very least a pause to the pause.
I think that notion is given further credibility by UST trading Wednesday in response to the FOMC statement; there really wasn’t any response. The same goes for eurodollars which seemed unperturbed by the almost dispirited desperation that the FOMC was trying to forward as a reasoned basis for whatever they might do. That, then, places far more emphasis on what might have occurred on May 6 to make such a unified impact in global money and credit markets.
That was the day that Janet Yellen made her belated wish that stock prices weren’t so winsome. She referred specifically to “potential dangers” due to “quite high” equity valuations, as well as reminding everyone of 2013’s “reach for yield” critique; i.e., asset bubbles. In terms of the idea that the FOMC may have changed its mind about ending ZIRP this is another factor that may have been missing to that point. I believe it was taken on March 18 that the FOMC then was projecting a change of heart based on “shocking” and “unexpected” economic weakness. Therefore, it was some initial hope that the economy alone would dispel the nervous urgency of Yellen et al to just get it over with.
However, Yellen’s curiously rather direct focus on the asset bubbles alters that dynamic, maybe significantly. There was always background noise in Bernanke’s last year (reach for yield) that the largest dangers were getting to be financial imbalances. The worry was that at some point it may not matter so much the economy as the Fed might find itself in the Chinese position where bubbles became the larger priority (by far) regardless of economic weakness. So Yellen’s May 6 monkey wrench might have brought that possibility back to the forefront, at least as far as some initial consideration.
Obviously, it hasn’t been taken as fixed income gospel yet, thus the sideways action lasting now a little over two weeks. This week’s FOMC statement did nothing at all to clear up any perceivable favor one way or the other. The utter mess of rationalizations could actually be taken as supporting both versions, hawkish and dovish; the continued allusion and even “official” recognition of some stark economic weakness and very little of organic trends to offset it, but also that the Fed may be excusing all that as still consistent in their view with the ending of ZIRP.
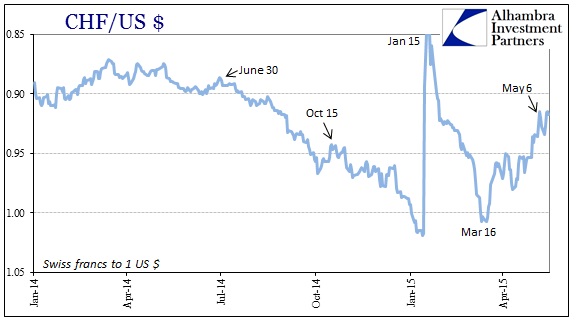
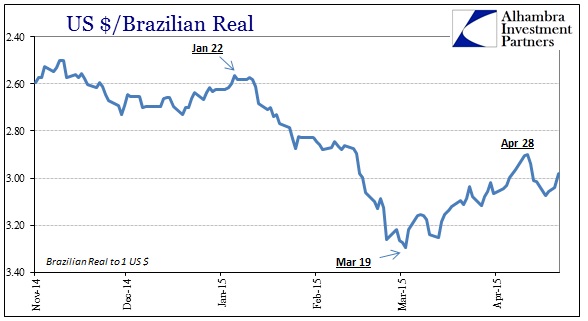
It isn’t completely clear either from other “dollar” proxies as to where bank balance sheets globally might be progressing. Again, there isn’t any sustained trend here to offer a more compelling interpretation, but enough of a muddle in which to accommodate the possibility of resumption toward tightening. Gold, for example, has been trading mostly sideways dating all the way back to late March. The Brazilian real devalued starting on April 28, and the Swiss franc at least stopped its ascendant run on May 6.
So these “dollar” and credit markets may not yet know what to do regarding Yellen’s version of “conundrum”, but it seems as if her introduction of complications has led to at least contemplation about it, tipping the scales, ever so slightly, back toward financial suicide.


