
Metals
PHYSICAL Silver Demand Will Destroy Paper Rigged Markets
by Steve St. Angelo, SRS Rocco Report:
If there’s one chart silver investors need to see, it’s the INDIA vs COMEX chart. This chart puts into perspective just how little Registered silver remains at the Comex warehouses. In addition, Comex Registered silver inventories continue to fall as two large transfers were reported over the past two days.
As reported by many precious metal websites, India continues to import record amounts of silver. According to Koos Jansen’s article at Bullionstar.com, India Precious Metals Import Explosive – August Gold 126t, Silver 1,400t:
When the Indian government raised the import duty on gold in 2013, it simultaneously raised the import duty on silver to 10 %. However, the premium on silver didn’t reach 25 % like gold. Many people switched to purchase silver instead of gold. Import since 2013 has increased dramatically.
Last May India imported a record 1,542 tonnes of silver, in August an estimated 1,400 tonnes was shipped in, which would be the second highest number on record – my record goes back to 2008.
Koos states initial trade data shows that India has imported 1,400 metric tons (mt) of silver in August. While this is lower than May’s 1,542 mt, it is the second highest on record. Now, what Koos didn’t mention is that analysts forecasted Indian silver imports would decline in 2015 due to easing of some gold restrictions. This was reported in the May ETF Securities Precious Metal Monthly Report:
With the election of Mr. Modi and some easing of the gold restrictions, silver use in India was generally expected to decline in 2015. But this has not been the case, as of the end of May. The latest data through April show India silver imports running about 30% above the 2014 record pace, on track for about 300 mn ounces of imports in 2015.
Now, data in that report is several months old. In their recently released August Report, ETF Securities forecasts Indian silver imports to reach 340 million oz (Moz) or 10,500 mt. Not only is that a lot of silver, it will consume 40% of global mine supply. Why is this such a big deal?
India Overtakes The United States As World’s Largest Silver Importer
Well, if we look at CHART #44 from my THE SILVER CHART REPORT, we can see just how much India’s silver imports have exploded recently compared to previous years:
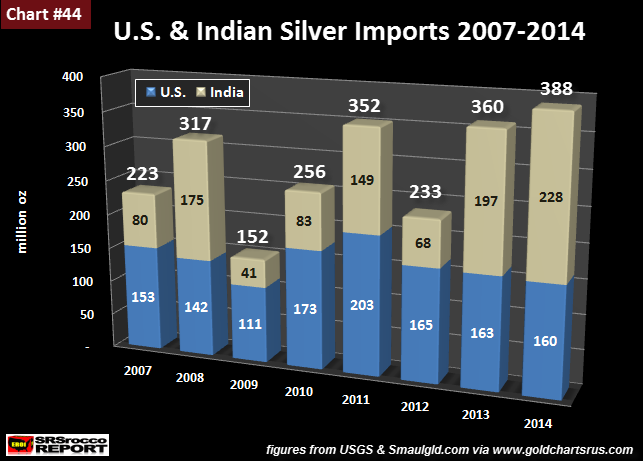
This chart represents the two largest silver importers in the world. As you can see, the United States consistently imported more silver than India. Annual U.S. silver imports varied between 150-200 Moz, while India’s silver imports were more volatile.
During the 2008 financial crisis, India’s silver imports surged to 175 Moz compared to 80 Moz during the previous year. After falling to a low of 41 Moz in 2009, India silver imports doubled to 83 Moz in 2010 and surged to 149 Moz as the silver price spiked to $50.
However, silver imports shrank considerably to 63 Moz in 2012 as Indian investors held back on purchases due to the lack of price direction in the silver market. In addition, many Indian investors decided to take some profits and became net sellers of silver bullion in the market.
Well, this all turned on a dime in 2013 (during two major silver price take-downs) as Indian silver imports jumped to 197 Moz in 2013 and even higher in 2014 to 228 Moz. If current silver import trends continue in both the U.S and India, this is will be the year-end result for 2015:
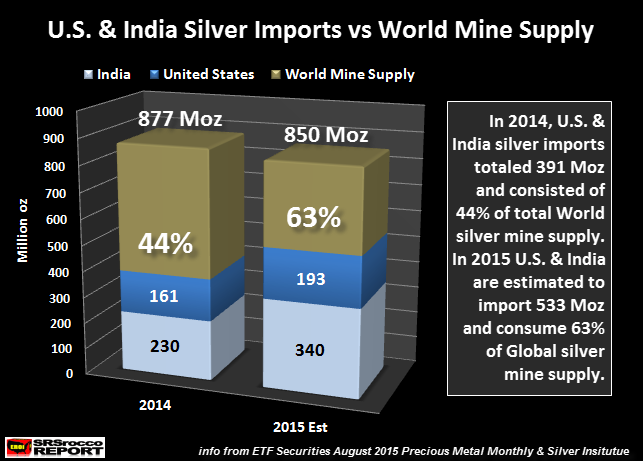
The United States and India are on track to import a massive 533 Moz, 63% of the forecasted 850 Moz of global mine supply. If India does import 320-340 Moz in 2015, its eight times more than their total imports in 2009 (41 Moz) and nearly five times what they imported in 2012 (68 Moz).
The reason U.S. silver imports have been the highest in the world and more consistent is due its large industrial demand base. India’s silver imports are more volatile as silver bar investment demand is the leading factor–it rises and falls due to price and market sentiment.
INDIA vs COMEX Registered Silver Inventories
Okay, here is the chart I mentioned in the beginning of the article. As stated above, India’s silver imports were 1,400 mt in August. If we compare India’s silver imports for just one month, they surpassed the total remaining Registered silver inventories at the Comex:
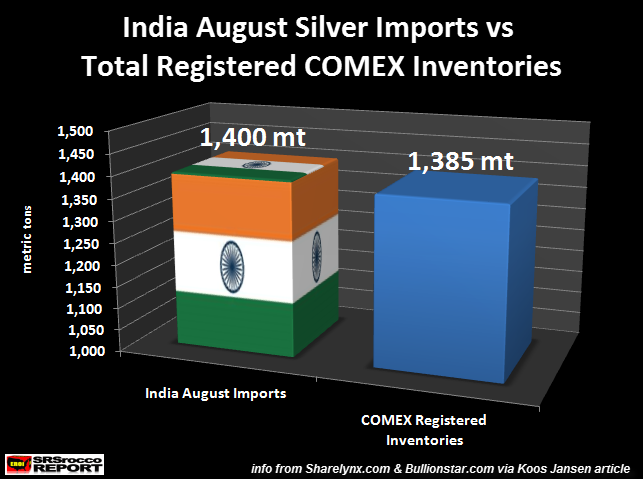
If we go by the Comex Registered silver inventory update as of yesterday (Wednesday), it held 44.3 Moz in its warehouses… this translates to 1,385 mt. Again, in just the month of August, India imported more silver (1,400 mt) than the total remaining Registered silver inventories (1,385 mt) at the Comex.
What is even more significant is the continued drain of Registered silver inventories at the Comex. We must remember, only Registered silver inventories are available for delivery into the market. Let’s take a look at the last two Comex silver warehouse inventory updates:
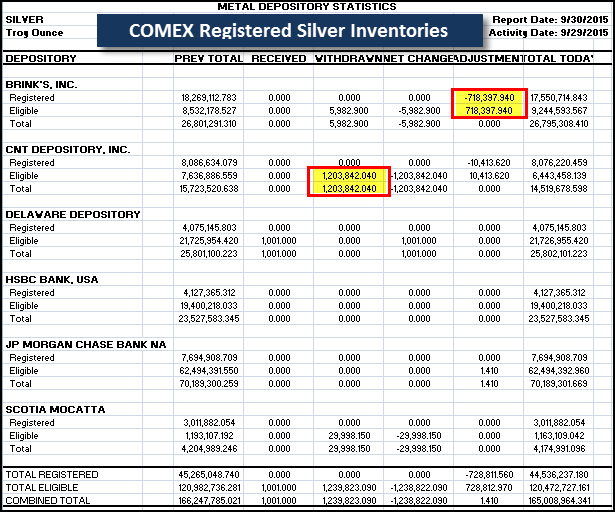
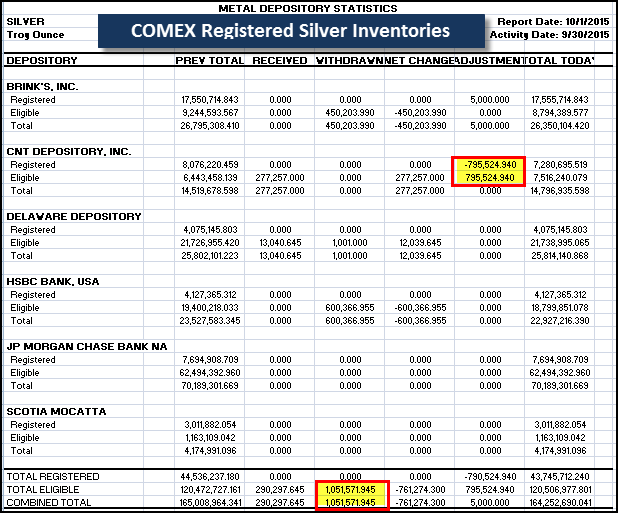
In the past two days, a net 2 Moz of silver were removed from total silver warehouse stocks at the Comex, while registered silver inventories declined to a low of 43.7 Moz for the year.
Investors need to realize the continued drain of Registered silver inventories at the Comex is due to increased investment demand mainly from North America and India. I am republishing this chart from a previous article because it shows just how fast silver is being withdrawn from the Registered silver inventories:
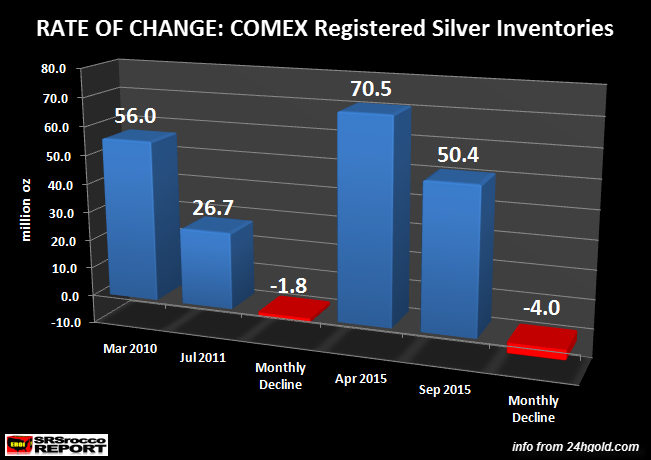
When the price of silver skyrocketed to $49 in 2011, Comex Registered inventories declined from 56 Moz in March 2010 to a low of 26.7 Moz in July 2011. Thus, the average monthly decline of Registered silver inventories was 1.8 Moz. Now, compare that to the present trend, but let’s update the data.
As we can see, the chart shows 50.4 Moz. However, the Registered silver inventories are now at 43.7 Moz. Which means, the present trend shows an average decline of 5.3 Moz a month. This is nearly three times greater than the 2010-2011 trend. This should wake up investors to the fact that… SOMETHING IS SERIOUSLY WRONG in the market.
Read More @ SRSroccoreport.com


