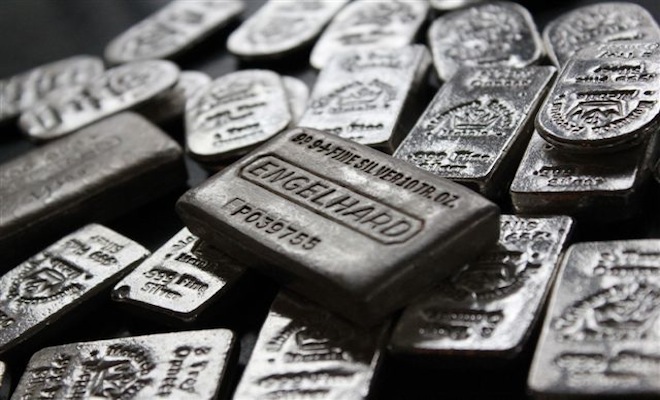
Metals
A Case For Much Higher Silver Prices
from SRS Rocco Report:
The folks at FreeGold (FOFOA) believe that when gold revalues to $45,000, silver would fall down to $1.85. They stated this in their recent article, FOFOA: Silver Dollar. Actually, FOFOA’s original calculation was done back in 2001, when they saw gold revaluing to $10,000 and silver down to a measly $.50. At the time FOFOA wrote that forecast, the price of gold was $261 and silver $4.37.
These would be impressive figures, if they made any sense. Unfortunately, the folks at FOFOA do what I call as “Forecast in a vacuum.” Basically, they arrive at their philosophy and metal price figures without considering certain outside influences. When I say vacuum, I am referring to the vacuum used in science class when air and outside forces were removed.
FOFOA is guilty of this in spades when it comes to their understanding of silver. Why? Because FOFOA and its hardcore followers look at the world through shiny gold-colored glasses. Here is one of their excerpts from 2001:
When the coming paper illusion price of gold is destroyed, sending its trading price way up and way down, several times, before shutdown,,,,,,,,,,,,,, the thinner paper markets of lesser metals will be absolutely devastated. Yes we will see $50.00 silver in our time,,,,,, $50.00 for a hundred ounce bar,,,,, that is! No less a relative price decline for the other metals is in store. Even if these actual dollar numbers prove incorrect,,,,,, relative inflation adjusted prices will show the exact same ratios to gold. The gain will truly be in gold!
Again, the folks at FOFOA believe the future value of gold is heading to the moon, while silver gets flushed down the toilet. Now, I am not going to get into all the details why I disagree with FreeGold’s position on silver, however I am going to challenge a few noteworthy items in their article.
Here is item number 1:
What would happen in this Freegold scenario is that the price of silver would decline to a level that constrained silver mining at the margin. Now there are two kinds of silver mine production. There is primary silver mine production, and secondary or silver production as a byproduct of mining other minerals. According to the Silver Institute website, 31% of global silver mining supply comes from primary silver mines at an average cost of $7.74 an ounce. So if the price drops below that number, then we lose the primary silver mines, but we still have the 69% of silver-as-a-byproduct mines, which brings us back down to production levels we saw when silver actually was less than $7.74 an ounce, which was as recently as 2005. And don’t forget that it got as low as $8.88 in 2008.
The folks at FOFOA believe the price of silver will fall even during a hyperinflation as demand for industrial silver declines. Thus, the falling price will kill supply at the margin…. which are the primary silver miners. Here is where they start to cherry pick data.
FOFOA states that the primary silver miners average cost per ounce is $7.74 according to the Silver Institute (data provided by Thomson Reuters GFMS World Silver Surveys). First of all, the $7.74 is a “Cash Cost” and not reflective of all actual costs. To arrive at a cash cost, the company excludes many costs and deducts by-product credits. Thus, cash cost accounting deludes the unsophisticated precious metals investor into believing it only costs $7.74 an ounce to produce silver. Most primary silver mining companies need their by-product revenue to fortify their balance sheet. The silver mining industry may list their by-product metal sales as credits, but these aren’t credits if the company suffers loses without them.
Secondly, the $7.74 cash cost figure is based on 75% of the primary silver miners. It says so in the 2015 World Silver Survey. The sample size GFMS uses to get their cash cost was 207 million oz (Moz), while total primary silver production was 270 Moz. Basically, GFMS calculated that $7.74 using the largest producers and top performing miners.
Regardless, cash costs do not represent the profitability of a company. As I mentioned above, the miners deduct their by-product metal sales to arrive at a low cash cost. FOFOA actually links one of my articles discussing cash costs back in 2011. Since then, my work has become more sophisticated into calculating the “Estimated Breakeven” for the primary silver miners.
FreeGold, FOFOA provides the example of Hecla’s low cash cost to justify their $2.75 price for silver after the big gold reset:
Hecla Mining Company, who claimed its “cash cost” for silver as a byproduct was only $1.15 per ounce in 2011, actually had a “complete cost per ounce” of $23.88! … Wow! At a $1.15 per ounce, $2.75 would be a 139% profit margin!
Hecla has one of the lowest cash costs, because they have one of the highest by-product metal sales. Hecla’s 2014 full year by-product metal sales were a whopping 65% ($325.4 million) of their total $500.7 million in revenue. By Hecla deducting their by-product revenue, they were able to state an ultra-low cash cost of $4.81. However, my estimated breakeven for Hecla in 2014 was $18.87.
Furthermore, cash cost accounting is not a GAAP – Generally Accepted Accounting Principle. The mining companies even state in their financial reports that cash costs have no “standardized meaning” in the industry:
“cash costs per ounce of silver”, which are used by the Company to manage and evaluate operating performance at each of the Company’s mines and are widely reported in the mining industry as benchmarks for performance, but do not have standardized meaning.
So, if a company has the same cost structure as Hecla, but a much lower by-product metal revenue, their cash cost would be higher because their deductions would be lower. For example, if the company only had 80% silver revenue and 20% by-product metal sales, their cash cost would be significantly higher as their deduction was much lower. Again, this has nothing to do with the profitability of the company.
Here is item number 2:
But if the author was right about the “break-even area” for silver, then how on earth did mines produce 20,000 tonnes of silver (and scrap refiners another 6,300 tonnes) in 2005, when the price of silver ranged from $6.39 to $9.23 per ounce? And how did we ever survive 2003, when the price ranged from $4.37 to $5.96?
FOFOA’s statement here shows their ignorance as they fail to factor in the price of oil and its relationship to the silver price. I discuss how the rise in the price of oil impacted the price of silver in my upcoming THE SILVER CHART REPORT. Here is Chart #24:
Read More @ SRSroccoReport.com


